Very basic introduction to data mining.
Introduction Exploratory-Data-Analysis Exploratory Data Analysis What is EDA EDA is like detective work: Exploratory data analysis is an attitude, a state of flexibility, a willingness to look for those things that we believe are not there, as well as those that we believe to be there.
EDA is active and incisive: Exploratory data analysis is actively incisive rather than passively descriptive, with real emphasis on the discovery of the unexpected.
Philosophy of EDA
Confirm understanding of the data
Keep an open mind and be willing to find something surprising
Iterate procedures below
Uncover new aspects of our data
Re-examine our understanding of the data
Continue exploration
To Carry Out EDA Connect what you find to the question and context
Plot data in multiple ways to get different insights
Transform variables to symmetrize distributions
Transform to straighten relationships
Derive new variables
Consider effect of other variables on distributions &
Something about Basic Data Visualize Features Seen in a Visual Summary
Mode(s) - values concentrate around particular points
Symmetry – skew left, symmetric, skew right distribution of values about center
Tails - long, short, normal (what expect for normal distribution)
Gaps - regions where no values observed
Outliers - unusually large/small values
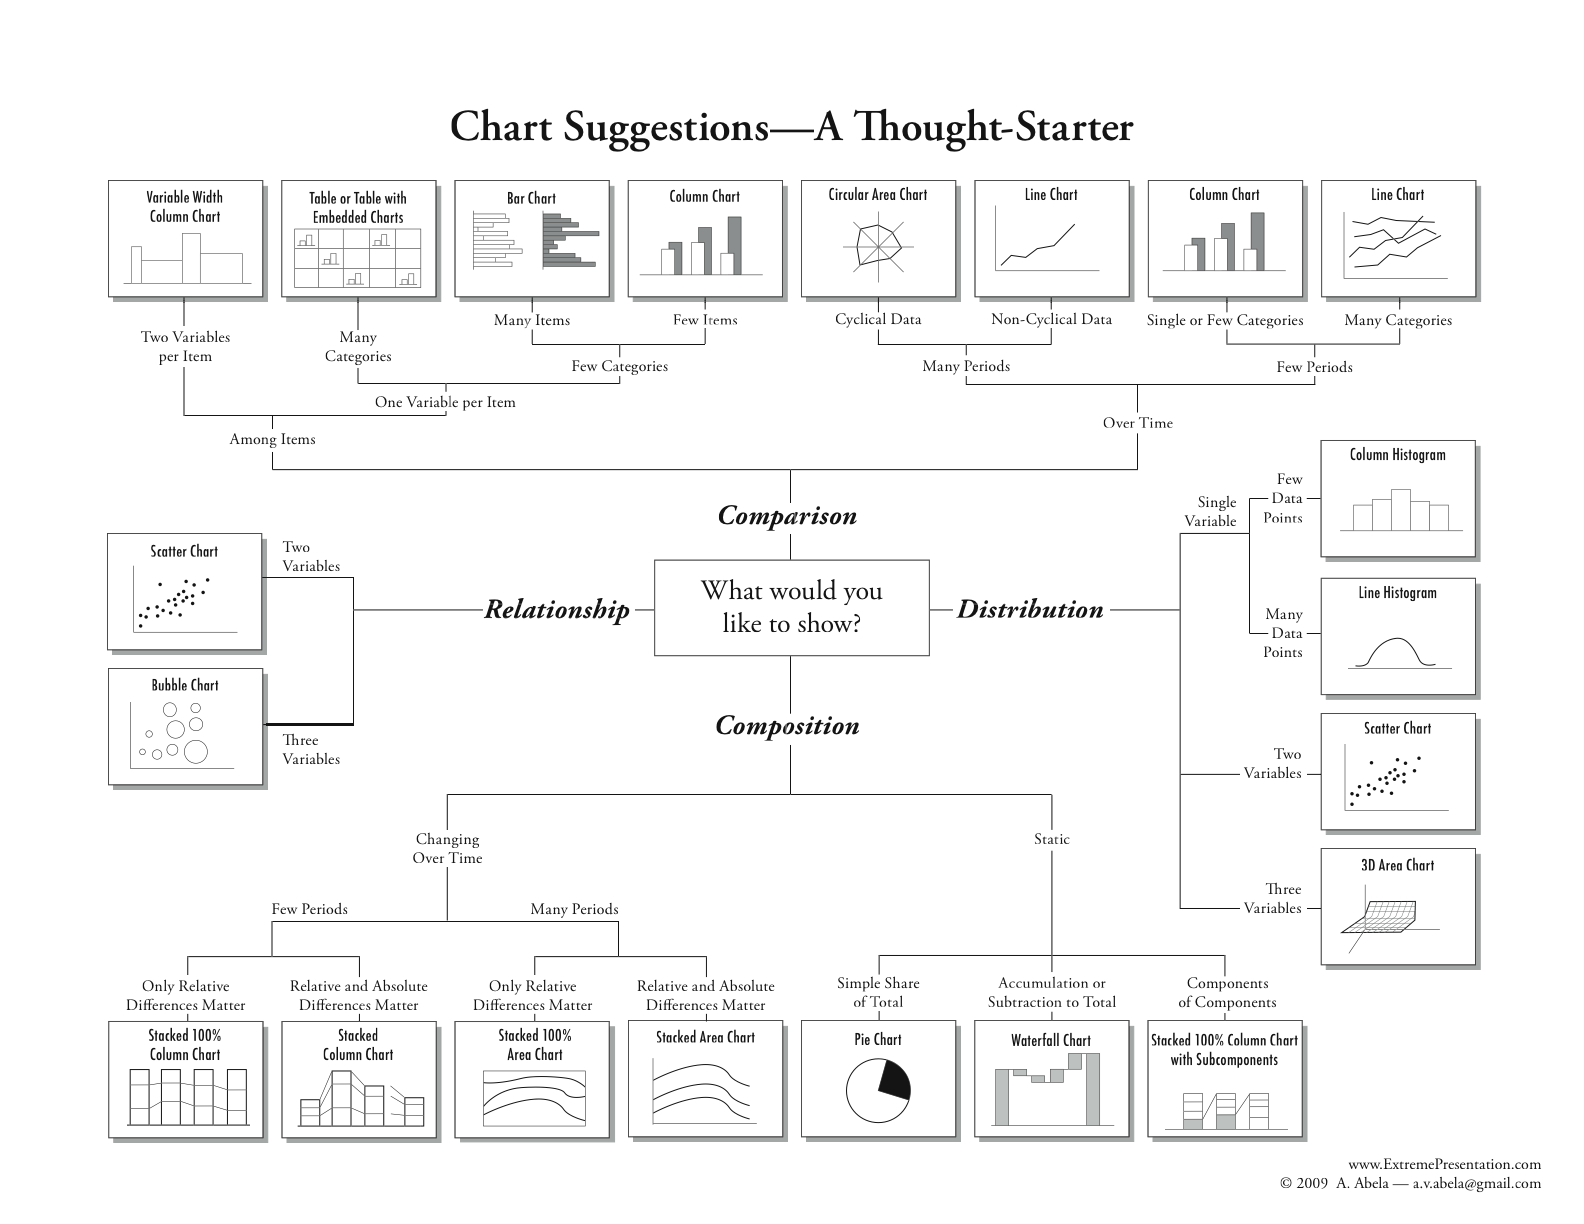
Choose Proper Charts
Practice 1 2 3 4 5 6 7 8 9 10 11 12 13 14 15 16 17 18 19 20 21 22 23 24 25 26 27 import osimport shutilimport numpy as npimport pandas as pdimport pandas_profiling as pdpfimport timeimport warningswarnings.filterwarnings('ignore' ) import matplotlibimport matplotlib.pyplot as pltimport seaborn as sbn%matplotlib inline import missingno as msnoimport pivottablejsimport lightgbm as lgbimport xgboost as xgbfrom sklearn.decomposition import PCA, FastICA, FactorAnalysis, SparsePCAfrom sklearn.model_selection import GridSearchCV, cross_val_score, StratifiedKFold, train_test_splitfrom sklearn.metrics import mean_squared_error, mean_absolute_erroros.chdir(r"D:\Tianchi" )
1 2 3 4 5 6 7 8 def Sta_inf (data ): print('-' *20 + 'Statistic Info' + '-' *20 +'\n' ) print('_min =\n' ,np.min (data)) print('_max =\n' ,np.max (data)) print('_mean =\n' ,np.mean(data)) print('_ptp =\n' ,np.ptp(data)) print('_std =\n' ,np.std(data)) print('_var =\n' ,np.var(data))
1 2 3 4 5 6 7 8 9 10 11 12 13 14 15 16 17 18 19 ''' 数据含义 SaleID 交易ID,唯一编码 name 汽车交易名称,已脱敏 regDate 汽车注册日期,例如20160101,2016年01月01日 model 车型编码,已脱敏 brand 汽车品牌,已脱敏 bodyType 车身类型:豪华轿车:0,微型车:1,厢型车:2,大巴车:3,敞篷车:4,双门汽车:5,商务车:6,搅拌车:7 fuelType 燃油类型:汽油:0,柴油:1,液化石油气:2,天然气:3,混合动力:4,其他:5,电动:6 gearbox 变速箱:手动:0,自动:1 power 发动机功率:范围 [ 0, 600 ] kilometer 汽车已行驶公里,单位万km notRepairedDamage 汽车有尚未修复的损坏:是:0,否:1 regionCode 地区编码,已脱敏 seller 销售方:个体:0,非个体:1 offerType 报价类型:提供:0,请求:1 creatDate 汽车上线时间,即开始售卖时间 price 二手车交易价格(预测目标) v系列特征 匿名特征,包含v0-14在内15个匿名特征 '''
1 2 3 4 5 6 7 data_train = pd.read_csv(r'data/used_car_train_20200313.csv' , encoding='utf-8' , sep=' ' , ) data_test = pd.read_csv(r'data/used_car_testA_20200313.csv' , encoding='utf-8' , sep=' ' , ) data_train.info() print('-' *20 ) print(data_train.head()) print('-' *20 ) print(data_train.describe().iloc[:,0 :4 ])
<class 'pandas.core.frame.DataFrame'>
RangeIndex: 150000 entries, 0 to 149999
Data columns (total 31 columns):
SaleID 150000 non-null int64
name 150000 non-null int64
regDate 150000 non-null int64
model 149999 non-null float64
brand 150000 non-null int64
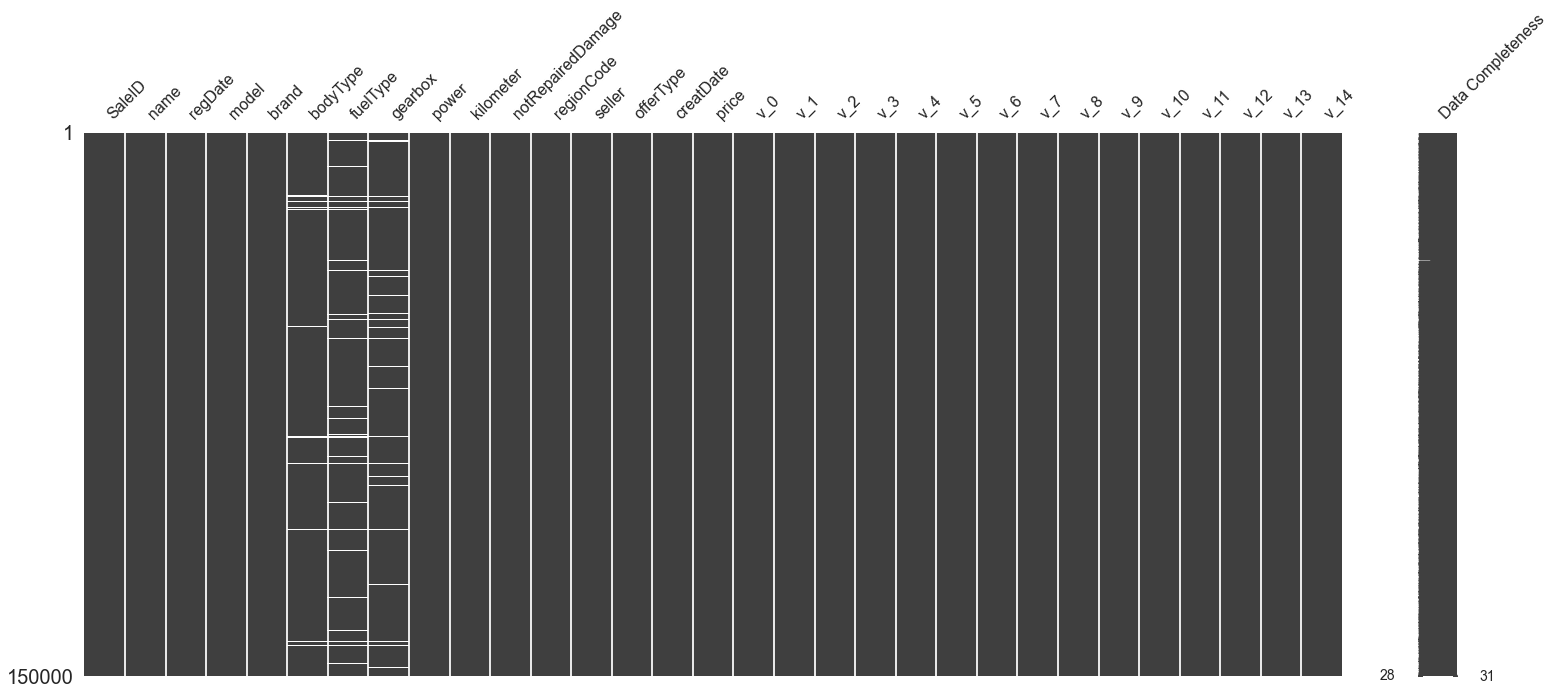
bodyType 145494 non-null float64
fuelType 141320 non-null float64
gearbox 144019 non-null float64
power 150000 non-null int64
kilometer 150000 non-null float64
notRepairedDamage 150000 non-null object
regionCode 150000 non-null int64
seller 150000 non-null int64
offerType 150000 non-null int64
creatDate 150000 non-null int64
price 150000 non-null int64
v_0 150000 non-null float64
v_1 150000 non-null float64
v_2 150000 non-null float64
v_3 150000 non-null float64
v_4 150000 non-null float64
v_5 150000 non-null float64
v_6 150000 non-null float64
v_7 150000 non-null float64
v_8 150000 non-null float64
v_9 150000 non-null float64
v_10 150000 non-null float64
v_11 150000 non-null float64
v_12 150000 non-null float64
v_13 150000 non-null float64
v_14 150000 non-null float64
dtypes: float64(20), int64(10), object(1)
memory usage: 35.5+ MB
--------------------
SaleID name regDate model brand bodyType fuelType gearbox power \
0 0 736 20040402 30.0 6 1.0 0.0 0.0 60
1 1 2262 20030301 40.0 1 2.0 0.0 0.0 0
2 2 14874 20040403 115.0 15 1.0 0.0 0.0 163
3 3 71865 19960908 109.0 10 0.0 0.0 1.0 193
4 4 111080 20120103 110.0 5 1.0 0.0 0.0 68
kilometer ... v_5 v_6 v_7 v_8 v_9 v_10 \
0 12.5 ... 0.235676 0.101988 0.129549 0.022816 0.097462 -2.881803
1 15.0 ... 0.264777 0.121004 0.135731 0.026597 0.020582 -4.900482
2 12.5 ... 0.251410 0.114912 0.165147 0.062173 0.027075 -4.846749
3 15.0 ... 0.274293 0.110300 0.121964 0.033395 0.000000 -4.509599
4 5.0 ... 0.228036 0.073205 0.091880 0.078819 0.121534 -1.896240
v_11 v_12 v_13 v_14
0 2.804097 -2.420821 0.795292 0.914762
1 2.096338 -1.030483 -1.722674 0.245522
2 1.803559 1.565330 -0.832687 -0.229963
3 1.285940 -0.501868 -2.438353 -0.478699
4 0.910783 0.931110 2.834518 1.923482
[5 rows x 31 columns]
--------------------
SaleID name regDate model
count 150000.000000 150000.000000 1.500000e+05 149999.000000
mean 74999.500000 68349.172873 2.003417e+07 47.129021
std 43301.414527 61103.875095 5.364988e+04 49.536040
min 0.000000 0.000000 1.991000e+07 0.000000
25% 37499.750000 11156.000000 1.999091e+07 10.000000
50% 74999.500000 51638.000000 2.003091e+07 30.000000
75% 112499.250000 118841.250000 2.007111e+07 66.000000
max 149999.000000 196812.000000 2.015121e+07 247.000000
1 2 3 4 5 6 7 col_num_train = data_train.select_dtypes(exclude='object' ).columns print(col_num_train) col_cat_train = data_train.select_dtypes(include='object' ).columns print(col_cat_train) col_num_test = data_test.select_dtypes(exclude='object' ).columns col_cat_test = data_test.select_dtypes(include='object' ).columns
Index(['SaleID', 'name', 'regDate', 'model', 'brand', 'bodyType', 'fuelType',
'gearbox', 'power', 'kilometer', 'regionCode', 'seller', 'offerType',
'creatDate', 'price', 'v_0', 'v_1', 'v_2', 'v_3', 'v_4', 'v_5', 'v_6',
'v_7', 'v_8', 'v_9', 'v_10', 'v_11', 'v_12', 'v_13', 'v_14'],
dtype='object')
Index(['notRepairedDamage'], dtype='object')
1 2 3 4 5 6 7 8 9 featured_cols = [col for col in col_num_train if 'Type' not in col\ and col not in ['SaleID' ,'name' ,'regDate' ,'creatDate' ,'price' ,'model' ,'brand' ,'regionCode' ,'seller' ]] data_train_X = data_train[featured_cols] data_train_Y = data_train['price' ] data_train_X.fillna(-1 ) data_train_Y.fillna(-1 ) data_test_X = data_test[featured_cols] print('X train shape =' ,data_train_X.shape) print('X test shape =' ,data_test_X.shape)
X train shape = (150000, 18)
X test shape = (50000, 18)
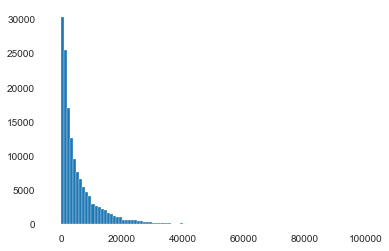
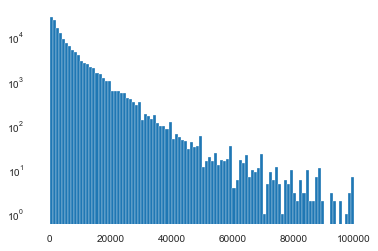
1 2 3 4 5 6 Sta_inf(data_train_Y) plt.hist(data_train_Y,bins=100 , log=False ) plt.show() plt.hist(data_train_Y,bins=100 , log=True ) plt.show() plt.close()
--------------------Statistic Info--------------------
_min =
11
_max =
99999
_mean =
5923.327333333334
_ptp =
99988
_std =
7501.973469876635
_var =
56279605.942732885
1 msno.matrix(data_train, labels=True )
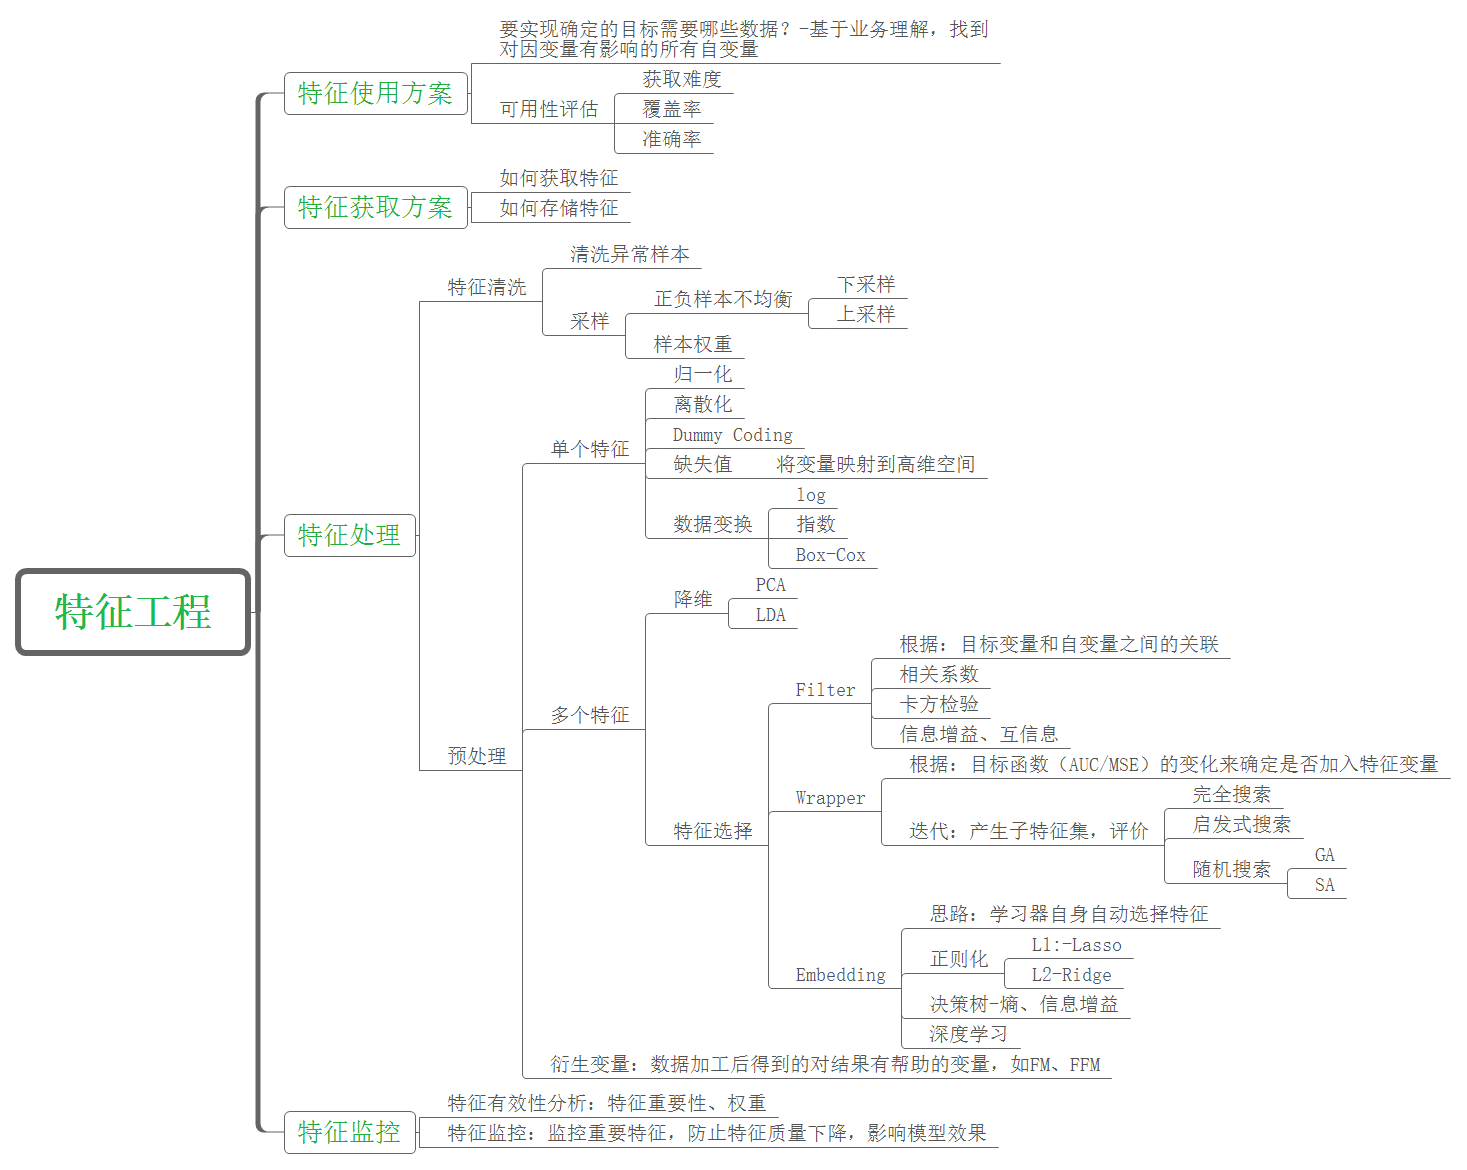
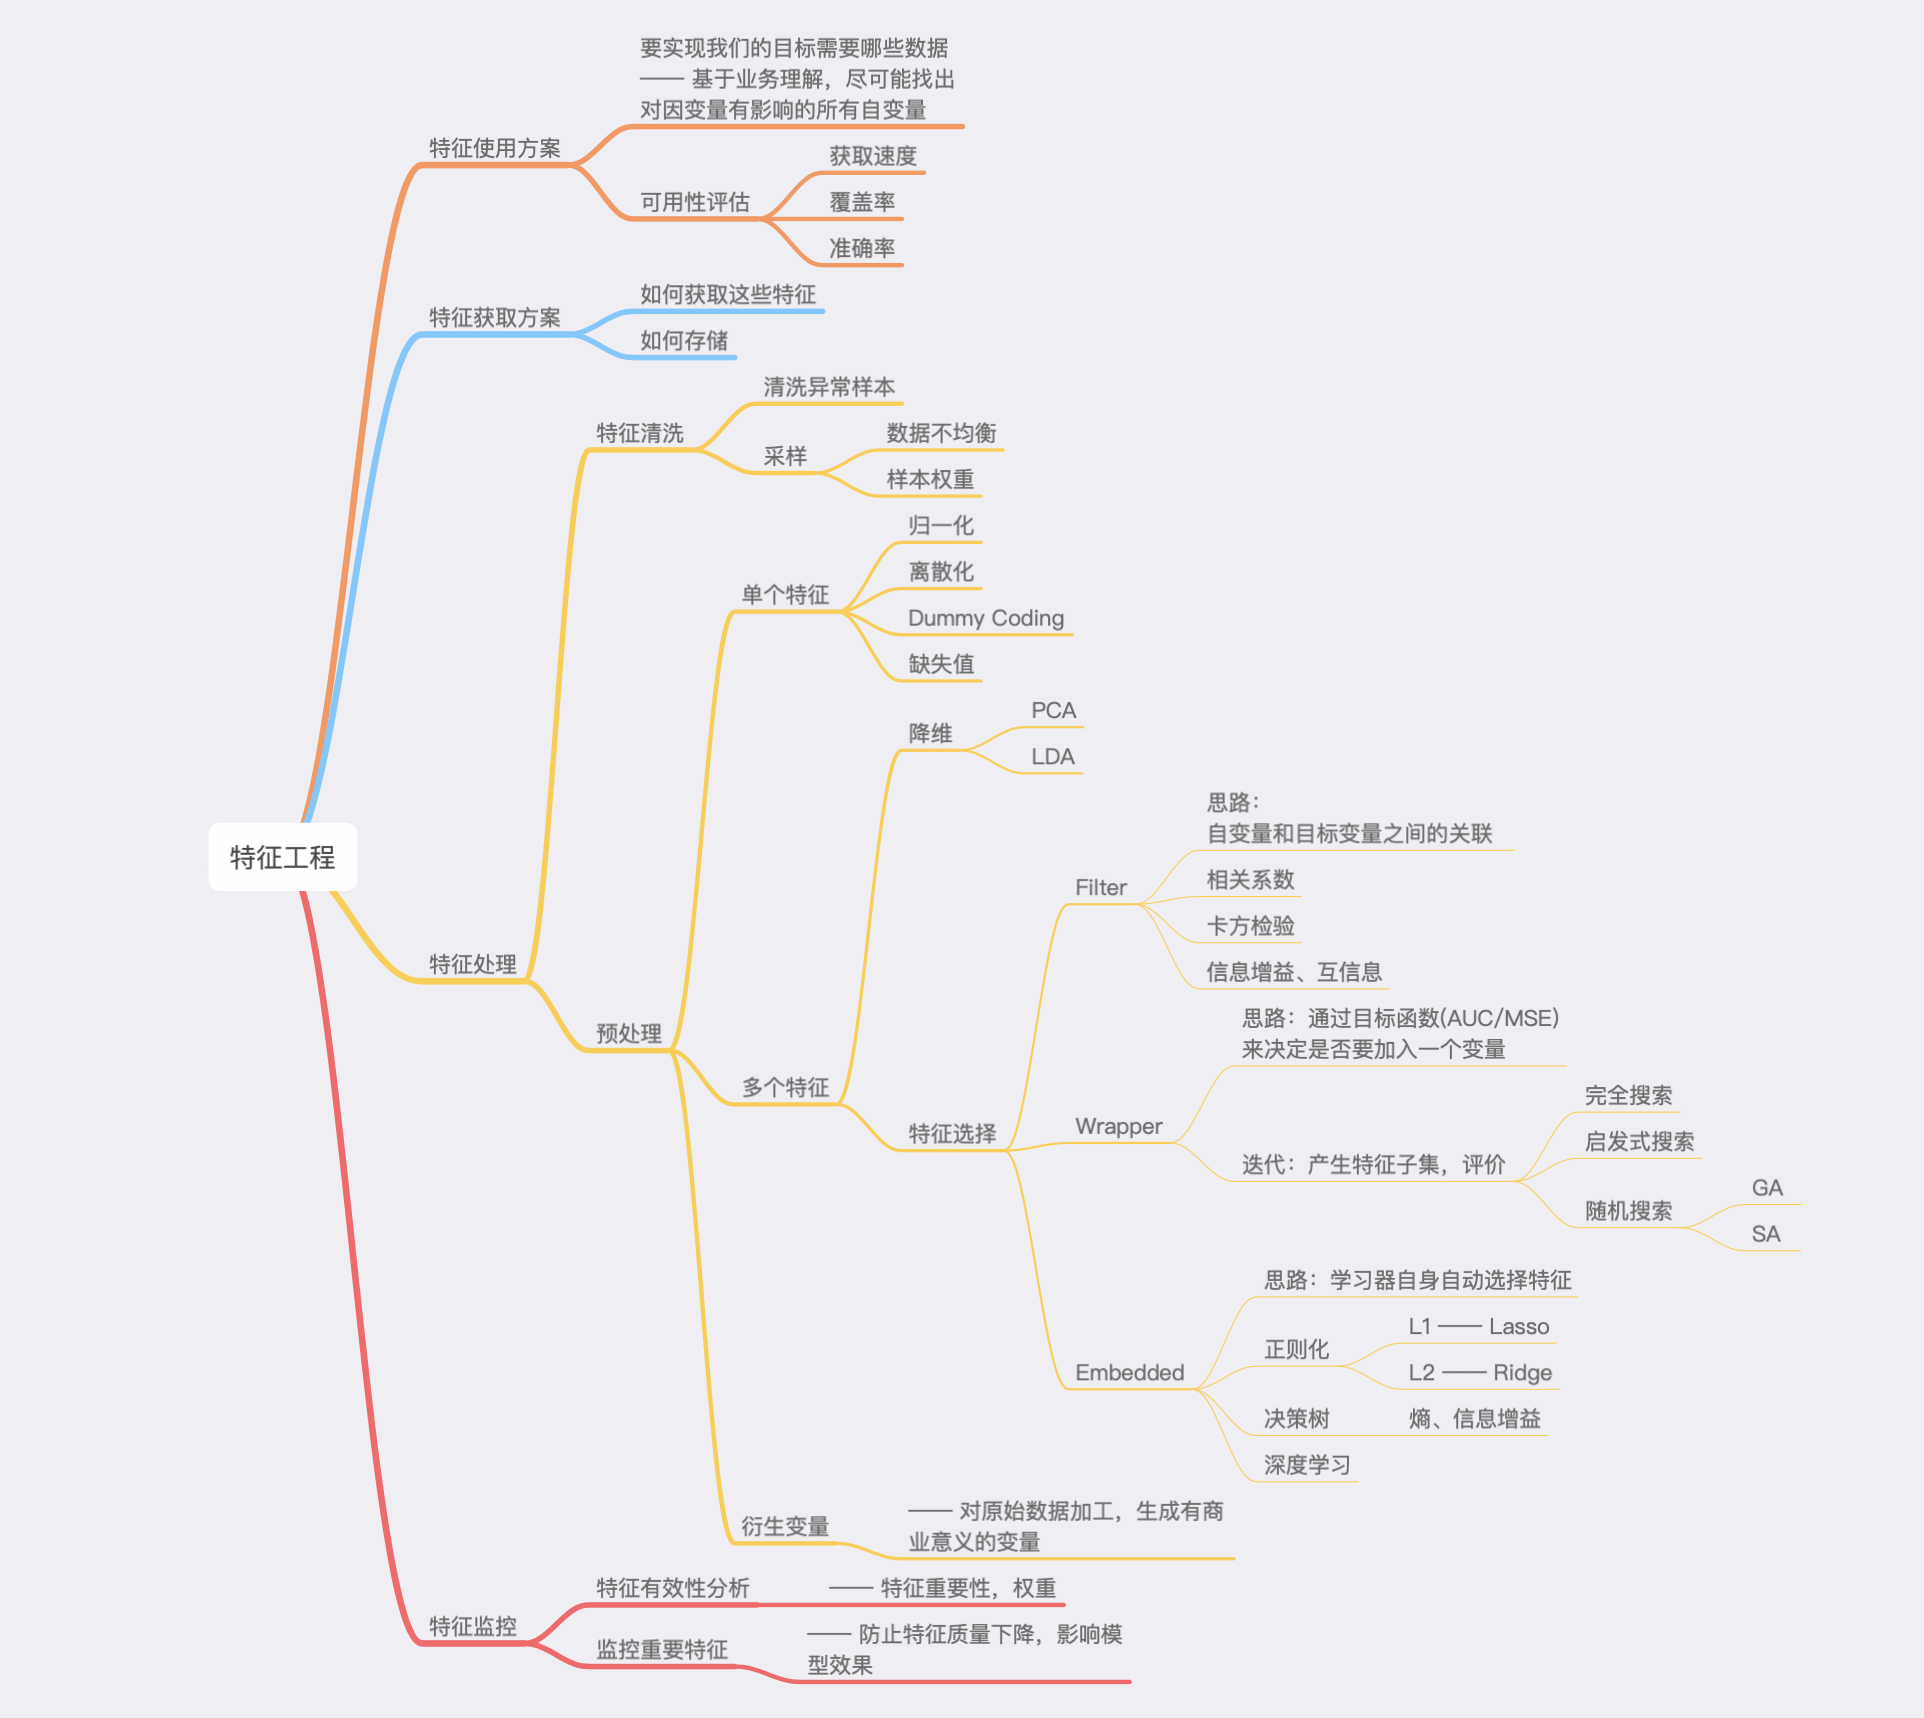
Feature Engineering Feature Engineering What is FE 特征工程的主要目的还是在于将数据转换为能更好地表示潜在问题的特征,从而提高机器学习的性能。比如,异常值处理是为了去除噪声,填补缺失值可以加入先验知识等。
特征构造也属于特征工程的一部分,其目的是为了增强数据的表达。
FE BASIC 有些数据的特征是匿名特征,这导致我们并不清楚特征相互直接的关联性,这时我们就只有单纯基于特征进行处理,比如装箱,groupby,agg 等这样一些操作进行一些特征统计,此外还可以对特征进行进一步的 log,exp 等变换,或者对多个特征进行四则运算、多项式组合等然后进行筛选。由于特性的匿名性其实限制了很多对于特征的处理,当然有些时候用 NN 去提取一些特征也会达到意想不到的良好效果。
对于知道特征含义的特征工程,特别是在工业类型比赛中,会基于信号处理,频域提取,丰度,偏度等构建更为有实际意义的特征,这就是结合背景的特征构建,在推荐系统中也是这样的,各种类型点击率统计,各时段统计,加用户属性的统计等等,这样一种特征构建往往要深入分析背后的业务逻辑或者说物理原理,从而才能更好的找到 magic。
当然特征工程其实是和模型结合在一起的,这就是为什么要为 LR NN 做分桶和特征归一化的原因,而对于特征的处理效果和特征重要性等往往要通过模型来验证。
To Carry Out FE
特征预处理
缺失值处理
不处理(针对类似 XGBoost 等树模型)
删除(缺失数据太多)
插值补全,包括均值/中位数/众数/建模预测/多重插补/压缩感知补全/矩阵补全等
分箱,缺失值一个箱
归一化
标准化(转换为标准正态分布)
归一化(抓换到 [0,1] 区间)
针对幂律分布,可以采用公式:$\log{\frac{1+x}{1+median}}$
异常值与数值截断
通过箱线图(或 3-Sigma)分析删除异常值
BOX-COX 转换(处理有偏分布)
长尾截断
非线性变换
无量纲处理
特征构建
离散特征
one-hot编码
散列编码
计数编码
离散特征之间交叉
离散特征与连续特征交叉
连续(数值)特征
时空特征
转化为数值
将时间离散化
行政区划表示
经纬度表示
距离表示
文本特征
富媒体特征
嵌入特征
特征选择
基于统计量选择 / Filter: 过滤法,按照发散性或者相关性对各个特征进行评分,设定阈值或者待选择阈值的个数,选择特征。
选择方差大的特征: 分布均匀的特征,样本之间差别不大,该特征不能很好区分不同样本,而分布不均匀的特征,样本之间有极大的区分度,因此通常可以选择方差较大的特征,去掉方差变化小的特征。具体方差多大算大,可以事先计算出所有特征的方差,选择一定比例(比如20%)的方差大的特征,或者可以设定一个阈值,选择方差大于阈值的特征。
皮尔逊相关系数: 用于衡量变量之间的线性相关性,取值区间为[-1,1]
覆盖率: 特征的覆盖率是指训练样本中有多大比例的样本具备该特征。我们首先计算每个特征的覆盖率,覆盖率很小的特征对模型的预测效果作用不大,可以剔除。
假设检验: 对于特征变量为类别变量而目标变量为连续数值变量的情况,可以使用方差分析,对于特征变量和目标变量都为连续数值变量的情况,可以使用皮尔森卡方检验。卡方统计量取值越大,特征相关性越高。
互信息: 互信息越大则表明两个变量相关性越高,互信息为 0 时,两个变量相互独立。因此可以根据特征变量和目标变量之间的互信息来选择互信息大的特征。
基于模型选择
基于模型参数 / 基于惩罚项的特征选择法 / Embedded / 集成法 : 先使用某些机器学习的算法和模型进行训练,得到各个特征的权值系数,根据系数从大到小选择特征。类似于Filter方法,但是是通过训练来确定特征的优劣。对于线性模型,可以直接基于模型系数大小来决定特征的重要程度。如果想要得到稀疏特征或者说是对特征进行降维,可以在模型上主动使用正则化技术。使用L1正则,调整正则项的权重,基本可以得到任意维度的稀疏特征。
子集选择 / 递归特征消除法 / Wrapper / 包装法: 根据目标函数(通常是预测效果评分),每次选择若干特征,或者排除若干特征。常见的有前向搜索和反向搜索两种思路。如果我们先从N个特征中选出一个最好的特征,然后让其余的N-1个特征分别与第一次选出的特征进行组合,从N-1个二元特征组合中选出最优组合,然后在上次的基础上,添加另一个新的特征,考虑3个特征的组合,依次类推,这种方法叫做前向搜索。反之,如果我们的目标是每次从已有特征中去掉一个特征,并从这些组合中选出最优组合,这种方法就是反向搜索。如果特征数量较多、模型复杂,那么这种选择的过程是非常耗时间和资源的。
基于树模型的特征选择法
降维: 当特征选择完成后,可以直接训练模型了,但是可能由于特征矩阵过大,导致计算量大,训练时间长的问题,因此降低特征矩阵维度也是必不可少的。常见的降维方法有主成分分析法(PCA)和线性判别分析(LDA),线性判别分析本身也是一个分类模型。PCA和LDA有很多的相似点,其本质是要将原始的样本映射到维度更低的样本空间中,但是PCA和LDA的映射目标不一样:PCA是为了让映射后的样本具有最大的发散性;而LDA是为了让映射后的样本有最好的分类性能。所以说PCA是一种无监督的降维方法,而LDA是一种有监督的降维方法。
特征评估
谓特征评估是在将特征灌入模型进行训练之前,事先评估特征的价值,提前发现可能存在的问题,及时解决,避免将有问题的特征导入模型,导致训练过程冗长而得不到好的结果。特征评估是对选择好的特征进行整体评价,而不是特征选择中所谓的对单个特征重要性的评判。特征评估包括特征的覆盖率、特征的维度、定性分析和定量分析等几种方式。
特征的覆盖率是指有多少比例的样本可以构建出相关特征,对于推荐系统来说,存在用户冷启动,因此对于新用户,如果选择的特征中包含从用户行为中获得的特征,那么我们是无法为他构建特征的,从而无法利用模型来为他进行推荐。
特征的维度衡量的是模型的表达能力,维度越高,模型表达能力越强,这时就需要更多的样本量和更多的计算资源、优秀的分布式计算框架来支撑模型的训练。为了达到较好的训练效果,一般对于简单模型可以用更多维度的特征,而对于复杂模型可以用更少的维度。
定性分析是指构建的特征是否跟用户行为是冲突的,可以拿熟悉的样本来做验证,比如在视频推荐中,可以根据自己的行为来定性验证标签的正确性。我个人最喜欢看恐怖电影,那么基于标签构建特征的话,那么对于我的样本,在恐怖这个标签上的权重应该是比其他标签权重大的。
定量分析,通过常用的离线评估指标,如Precitson、Recall、AUC等等来验证模型的效果,当然,最终需要上线做AB测试来看是否对核心用户体验、商业化指标有提升。
Something about FE
Practice 1 2 3 4 5 6 7 8 9 10 11 12 13 14 15 16 17 18 19 20 21 22 23 24 25 26 27 import osimport shutilimport numpy as npimport pandas as pdimport pandas_profiling as pdpfimport timeimport warningswarnings.filterwarnings('ignore' ) import matplotlibimport matplotlib.pyplot as pltimport seaborn as sbn%matplotlib inline import missingno as msnoimport pivottablejsimport lightgbm as lgbimport xgboost as xgbfrom sklearn.decomposition import PCA, FastICA, FactorAnalysis, SparsePCAfrom sklearn.model_selection import GridSearchCV, cross_val_score, StratifiedKFold, train_test_splitfrom sklearn.metrics import mean_squared_error, mean_absolute_erroros.chdir(r"D:\Tianchi" )
1 2 3 4 5 6 7 8 9 10 11 12 13 14 15 16 17 18 19 ''' 数据含义 SaleID 交易ID,唯一编码 name 汽车交易名称,已脱敏 regDate 汽车注册日期,例如20160101,2016年01月01日 model 车型编码,已脱敏 brand 汽车品牌,已脱敏 bodyType 车身类型:豪华轿车:0,微型车:1,厢型车:2,大巴车:3,敞篷车:4,双门汽车:5,商务车:6,搅拌车:7 fuelType 燃油类型:汽油:0,柴油:1,液化石油气:2,天然气:3,混合动力:4,其他:5,电动:6 gearbox 变速箱:手动:0,自动:1 power 发动机功率:范围 [ 0, 600 ] kilometer 汽车已行驶公里,单位万km notRepairedDamage 汽车有尚未修复的损坏:是:0,否:1 regionCode 地区编码,已脱敏 seller 销售方:个体:0,非个体:1 offerType 报价类型:提供:0,请求:1 creatDate 汽车上线时间,即开始售卖时间 price 二手车交易价格(预测目标) v系列特征 匿名特征,包含v0-14在内15个匿名特征 '''
Feature Engineering Data Washing 1 2 3 4 5 6 7 8 9 data_train = pd.read_csv(r'data/used_car_train_20200313.csv' , encoding='utf-8' , sep=' ' , ) data_test = pd.read_csv(r'data/used_car_testA_20200313.csv' , encoding='utf-8' , sep=' ' , ) print('-' *20 ) print(data_train.shape, '\n' , data_train.columns) print(data_train.describe().iloc[:,0 :4 ]) print('-' *20 ) print(data_test.shape, '\n' , data_test.columns) print(data_test.describe().iloc[:,0 :4 ])
--------------------
(150000, 31)
Index(['SaleID', 'name', 'regDate', 'model', 'brand', 'bodyType', 'fuelType',
'gearbox', 'power', 'kilometer', 'notRepairedDamage', 'regionCode',
'seller', 'offerType', 'creatDate', 'price', 'v_0', 'v_1', 'v_2', 'v_3',
'v_4', 'v_5', 'v_6', 'v_7', 'v_8', 'v_9', 'v_10', 'v_11', 'v_12',
'v_13', 'v_14'],
dtype='object')
SaleID name regDate model
count 150000.000000 150000.000000 1.500000e+05 149999.000000
mean 74999.500000 68349.172873 2.003417e+07 47.129021
std 43301.414527 61103.875095 5.364988e+04 49.536040
min 0.000000 0.000000 1.991000e+07 0.000000
25% 37499.750000 11156.000000 1.999091e+07 10.000000
50% 74999.500000 51638.000000 2.003091e+07 30.000000
75% 112499.250000 118841.250000 2.007111e+07 66.000000
max 149999.000000 196812.000000 2.015121e+07 247.000000
--------------------
(50000, 30)
Index(['SaleID', 'name', 'regDate', 'model', 'brand', 'bodyType', 'fuelType',
'gearbox', 'power', 'kilometer', 'notRepairedDamage', 'regionCode',
'seller', 'offerType', 'creatDate', 'v_0', 'v_1', 'v_2', 'v_3', 'v_4',
'v_5', 'v_6', 'v_7', 'v_8', 'v_9', 'v_10', 'v_11', 'v_12', 'v_13',
'v_14'],
dtype='object')
SaleID name regDate model
count 50000.000000 50000.000000 5.000000e+04 50000.000000
mean 174999.500000 68542.223280 2.003393e+07 46.844520
std 14433.901067 61052.808133 5.368870e+04 49.469548
min 150000.000000 0.000000 1.991000e+07 0.000000
25% 162499.750000 11203.500000 1.999091e+07 10.000000
50% 174999.500000 52248.500000 2.003091e+07 29.000000
75% 187499.250000 118856.500000 2.007110e+07 65.000000
max 199999.000000 196805.000000 2.015121e+07 246.000000
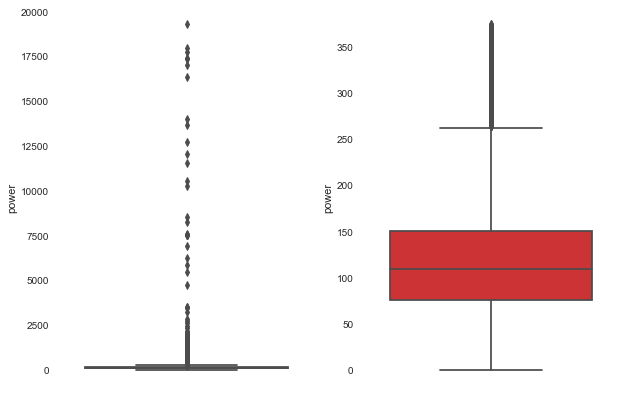
1 2 3 4 5 6 7 8 9 10 11 12 13 14 15 16 17 18 19 20 21 22 23 24 25 26 27 28 29 30 31 32 33 34 35 36 37 38 39 40 41 42 43 44 45 46 def outliers_proc (data: pd.core.frame.DataFrame, col_name: [str ], scale=3 ) -> pd.core.frame.DataFrame: """ 用于清洗异常值,默认用 box_plot(scale=3)进行清洗 :param data: 接收 dataFrame 数据格式 :param col_name: pandas 列名 :param scale: 尺度 :return: """ def box_plot_outliers (data_ser: pd.core.series.Series, box_scale: int ) -> pd.core.series.Series: """ 利用箱线图去除异常值 :param data_ser: 接收 pandas.Series 数据格式 :param box_scale: 箱线图尺度, :return: """ iqr = box_scale * (data_ser.quantile(0.75 ) - data_ser.quantile(0.25 )) val_low = data_ser.quantile(0.25 ) - iqr val_up = data_ser.quantile(0.75 ) + iqr rule_low = (data_ser < val_low) rule_up = (data_ser > val_up) return (rule_low, rule_up), (val_low, val_up) data_n = data.copy() data_series = data_n[col_name] rule, value = box_plot_outliers(data_series, box_scale=scale) index = np.arange(data_series.shape[0 ])[rule[0 ] | rule[1 ]] print("Delete number is: {}" .format (len (index))) data_n = data_n.drop(index) data_n.reset_index(drop=True , inplace=True ) print("Now column number is: {}" .format (data_n.shape[0 ])) index_low = np.arange(data_series.shape[0 ])[rule[0 ]] outliers = data_series.iloc[index_low] print("Description of data less than the lower bound is:" ) print(pd.Series(outliers).describe()) index_up = np.arange(data_series.shape[0 ])[rule[1 ]] outliers = data_series.iloc[index_up] print("Description of data larger than the upper bound is:" ) print(pd.Series(outliers).describe()) fig, ax = plt.subplots(1 , 2 , figsize=(10 , 7 )) sbn.boxplot(y=data[col_name], data=data, palette="Set1" , ax=ax[0 ]) sbn.boxplot(y=data_n[col_name], data=data_n, palette="Set1" , ax=ax[1 ]) return data_n
1 data_train = outliers_proc(data_train, 'power' , scale=3 )
Delete number is: 963
Now column number is: 149037
Description of data less than the lower bound is:
count 0.0
mean NaN
std NaN
min NaN
25% NaN
50% NaN
75% NaN
max NaN
Name: power, dtype: float64
Description of data larger than the upper bound is:
count 963.000000
mean 846.836968
std 1929.418081
min 376.000000
25% 400.000000
50% 436.000000
75% 514.000000
max 19312.000000
Name: power, dtype: float64
1 2 3 4 data_train['is_train_data' ] = 1 data_test['is_train_data' ] = 0 data = pd.concat([data_train, data_test], ignore_index=True )
1 2 3 4 5 data['used_time' ] = ( pd.to_datetime(data['creatDate' ], format ='%Y%m%d' , errors='coerce' ) - pd.to_datetime(data['regDate' ], format ='%Y%m%d' , errors='coerce' )).dt.days
1 data['city' ] = data['regionCode' ].apply(lambda x : str (x)[:-3 ])
1 2 3 4 5 6 7 8 9 10 11 12 13 14 15 16 17 Train_gb = data_train.groupby("brand" ) all_info = {} for kind, kind_data in Train_gb: info = {} kind_data = kind_data[kind_data['price' ] > 0 ] info['brand_amount' ] = len (kind_data) info['brand_price_max' ] = kind_data.price.max () info['brand_price_median' ] = kind_data.price.median() info['brand_price_min' ] = kind_data.price.min () info['brand_price_sum' ] = kind_data.price.sum () info['brand_price_std' ] = kind_data.price.std() info['brand_price_average' ] = round (kind_data.price.sum () / (len (kind_data) + 1 ), 2 ) all_info[kind] = info brand_fe = pd.DataFrame(all_info).T.reset_index().rename(columns={"index" : "brand" }) data = data.merge(brand_fe, how='left' , on='brand' )
1 2 3 4 5 6 7 8 9 10 11 12 13 14 bin = [i*10 for i in range (31 )]data['power_bin' ] = pd.cut(data['power' ], bin , labels=False ) data[['power_bin' , 'power' ]].head()
power_bin
power
0
5.0
60
1
NaN
0
2
16.0
163
3
19.0
193
4
6.0
68
1 2 3 data.drop(['creatDate' , 'regDate' , 'regionCode' ], axis=1 , inplace=True ) print(data.shape) data.columns
(199037, 39)
Index(['SaleID', 'bodyType', 'brand', 'fuelType', 'gearbox', 'is_train_data',
'kilometer', 'model', 'name', 'notRepairedDamage', 'offerType', 'power',
'price', 'seller', 'v_0', 'v_1', 'v_10', 'v_11', 'v_12', 'v_13', 'v_14',
'v_2', 'v_3', 'v_4', 'v_5', 'v_6', 'v_7', 'v_8', 'v_9', 'used_time',
'city', 'brand_amount', 'brand_price_max', 'brand_price_median',
'brand_price_min', 'brand_price_sum', 'brand_price_std',
'brand_price_average', 'power_bin'],
dtype='object')
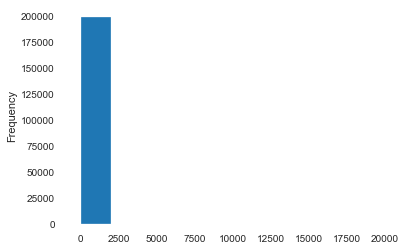
1 2 data.to_csv('data_for_tree.csv' , index=0 ) data['power' ].hist()
<matplotlib.axes._subplots.AxesSubplot at 0x267a92468d0>
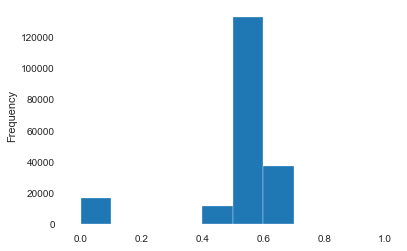
1 2 3 4 5 6 7 from sklearn import preprocessingmin_max_scaler = preprocessing.MinMaxScaler() data['power' ] = np.log(data['power' ] + 1 ) data['power' ] = ((data['power' ] - np.min (data['power' ])) / (np.max (data['power' ]) - np.min (data['power' ]))) data['power' ].plot.hist()
<matplotlib.axes._subplots.AxesSubplot at 0x267abf56160>
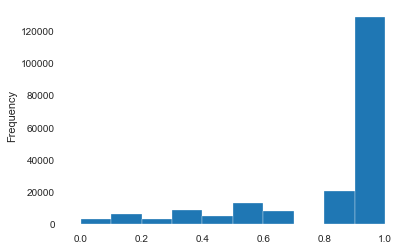
1 2 3 4 data['kilometer' ] = ((data['kilometer' ] - np.min (data['kilometer' ])) / (np.max (data['kilometer' ]) - np.min (data['kilometer' ]))) data['kilometer' ].plot.hist()
<matplotlib.axes._subplots.AxesSubplot at 0x267adbc2dd8>
1 2 3 4 5 6 7 8 def max_min (x ): return (x - np.min (x)) / (np.max (x) - np.min (x)) data[['brand_amount' ,'brand_price_average' ,'brand_price_max' , 'brand_price_median' ,'brand_price_min' ,'brand_price_std' ,'brand_price_sum' ,]] = \data[['brand_amount' ,'brand_price_average' ,'brand_price_max' , 'brand_price_median' ,'brand_price_min' ,'brand_price_std' ,'brand_price_sum' ,]].apply(max_min)
1 2 3 4 5 data = pd.get_dummies(data, columns=['model' , 'brand' , 'bodyType' , 'fuelType' , 'gearbox' , 'notRepairedDamage' , 'power_bin' ]) print(data.shape) data.columns
(199037, 370)
Index(['SaleID', 'is_train_data', 'kilometer', 'name', 'offerType', 'power',
'price', 'seller', 'v_0', 'v_1',
...
'power_bin_20.0', 'power_bin_21.0', 'power_bin_22.0', 'power_bin_23.0',
'power_bin_24.0', 'power_bin_25.0', 'power_bin_26.0', 'power_bin_27.0',
'power_bin_28.0', 'power_bin_29.0'],
dtype='object', length=370)
1 2 data.to_csv('data_for_lr.csv' , index=0 )
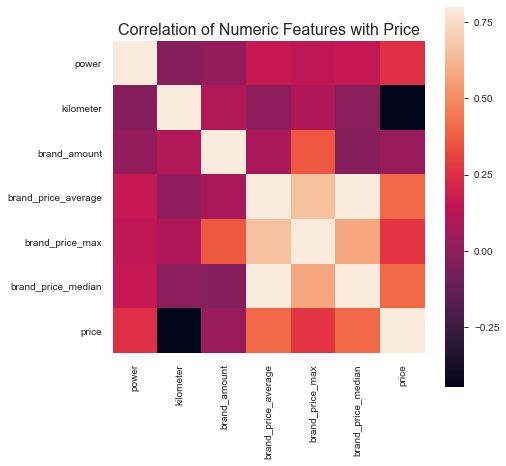
特征-过滤式 1 2 3 4 5 6 7 8 data_numeric = data[['power' , 'kilometer' , 'brand_amount' , 'brand_price_average' , 'brand_price_max' , 'brand_price_median' ,'price' ]] correlation = data_numeric.corr() f , ax = plt.subplots(figsize = (7 , 7 )) plt.title('Correlation of Numeric Features with Price' ,y=1 ,size=16 ) sbn.heatmap(correlation,square = True , vmax=0.8 )
<matplotlib.axes._subplots.AxesSubplot at 0x2679cfe6be0>
Modeling and Parameters Basic Models
线性回归模型:
线性回归对于特征的要求;
处理长尾分布;
理解线性回归模型;
模型性能验证:
评价函数与目标函数;
交叉验证方法;
留一验证方法;
针对时间序列问题的验证;
绘制学习率曲线;
绘制验证曲线;
嵌入式特征选择:
模型对比:
模型调参:
Practice 1 2 3 4 5 6 7 8 9 10 11 12 13 14 15 16 17 18 19 20 21 22 23 24 25 26 27 import osimport shutilimport numpy as npimport pandas as pdimport pandas_profiling as pdpfimport timeimport warningswarnings.filterwarnings('ignore' ) import matplotlibimport matplotlib.pyplot as pltimport seaborn as sbn%matplotlib inline import missingno as msnoimport pivottablejsimport lightgbm as lgbimport xgboost as xgbfrom sklearn.decomposition import PCA, FastICA, FactorAnalysis, SparsePCAfrom sklearn.model_selection import GridSearchCV, cross_val_score, StratifiedKFold, train_test_splitfrom sklearn.metrics import mean_squared_error, mean_absolute_erroros.chdir(r"D:\Tianchi" )
1
2
3
4
5
6
7
8
9
10
11
12
13
14
15
16
17
18
19
''' 数据含义 SaleID 交易ID,唯一编码 name 汽车交易名称,已脱敏 regDate 汽车注册日期,例如20160101,2016年01月01日 model 车型编码,已脱敏 brand 汽车品牌,已脱敏 bodyType 车身类型:豪华轿车:0,微型车:1,厢型车:2,大巴车:3,敞篷车:4,双门汽车:5,商务车:6,搅拌车:7 fuelType 燃油类型:汽油:0,柴油:1,液化石油气:2,天然气:3,混合动力:4,其他:5,电动:6 gearbox 变速箱:手动:0,自动:1 power 发动机功率:范围 [ 0, 600 ] kilometer 汽车已行驶公里,单位万km notRepairedDamage 汽车有尚未修复的损坏:是:0,否:1 regionCode 地区编码,已脱敏 seller 销售方:个体:0,非个体:1 offerType 报价类型:提供:0,请求:1 creatDate 汽车上线时间,即开始售卖时间 price 二手车交易价格(预测目标) v系列特征 匿名特征,包含v0-14在内15个匿名特征 '''
1 2 3 4 5 6 7 8 9 10 11 12 13 14 15 16 17 18 19 20 21 22 23 24 25 26 27 28 29 30 31 32 33 34 35 36 def reduce_mem_usage (df ): """ iterate through all the columns of a dataframe and modify the data type to reduce memory usage. """ start_mem = df.memory_usage().sum () print('Memory usage of dataframe is {:.2f} MB' .format (start_mem)) for col in df.columns: col_type = df[col].dtype if col_type != object : c_min = df[col].min () c_max = df[col].max () if str (col_type)[:3 ] == 'int' : if c_min > np.iinfo(np.int8).min and c_max < np.iinfo(np.int8).max : df[col] = df[col].astype(np.int8) elif c_min > np.iinfo(np.int16).min and c_max < np.iinfo(np.int16).max : df[col] = df[col].astype(np.int16) elif c_min > np.iinfo(np.int32).min and c_max < np.iinfo(np.int32).max : df[col] = df[col].astype(np.int32) elif c_min > np.iinfo(np.int64).min and c_max < np.iinfo(np.int64).max : df[col] = df[col].astype(np.int64) else : if c_min > np.finfo(np.float16).min and c_max < np.finfo(np.float16).max : df[col] = df[col].astype(np.float16) elif c_min > np.finfo(np.float32).min and c_max < np.finfo(np.float32).max : df[col] = df[col].astype(np.float32) else : df[col] = df[col].astype(np.float64) else : df[col] = df[col].astype('category' ) end_mem = df.memory_usage().sum () print('Memory usage after optimization is: {:.2f} MB' .format (end_mem)) print('Decreased by {:.1f}%' .format (100 * (start_mem - end_mem) / start_mem)) return df
1 sample_feature = reduce_mem_usage(pd.read_csv('data_for_tree.csv' ))
Memory usage of dataframe is 62099672.00 MB
Memory usage after optimization is: 16520303.00 MB
Decreased by 73.4%
1 continuous_feature_names = [x for x in sample_feature.columns if x not in ['price' ,'brand' ,'model' ,'brand' ]]
1 2 3 4 5 6 sample_feature = sample_feature.dropna().replace('-' , 0 ).reset_index(drop=True ) sample_feature['notRepairedDamage' ] = sample_feature['notRepairedDamage' ].astype(np.float32) data_train = sample_feature[continuous_feature_names + ['price' ]] data_train_X = data_train[continuous_feature_names] data_train_y = data_train['price' ]
1 2 3 4 5 from sklearn.linear_model import LinearRegressionmodel = LinearRegression(normalize=True ) model = model.fit(data_train_X, data_train_y) 'intercept:' + str (model.intercept_)sorted (dict (zip (continuous_feature_names, model.coef_)).items(), key=lambda x:x[1 ], reverse=True )
[('v_6', 3367064.3416418973),
('v_8', 700675.5609398854),
('v_9', 170630.27723220928),
('v_7', 32322.661932026494),
('v_12', 20473.67079690079),
('v_3', 17868.079541462153),
('v_11', 11474.938996675626),
('v_13', 11261.764560002604),
('v_10', 2683.920090576799),
('gearbox', 881.8225039247895),
('fuelType', 363.90425072159366),
('bodyType', 189.60271012072778),
('city', 44.94975120521572),
('power', 28.553901616757216),
('brand_price_median', 0.5103728134077985),
('brand_price_std', 0.4503634709262824),
('brand_amount', 0.14881120395066205),
('brand_price_max', 0.003191018670313502),
('SaleID', 5.3559899198577976e-05),
('offerType', 6.017042323946953e-06),
('seller', 1.6369158402085304e-06),
('is_train_data', -5.66341623198241e-06),
('brand_price_sum', -2.1750068681876833e-05),
('name', -0.0002980012713063814),
('used_time', -0.002515894332869914),
('brand_price_average', -0.40490484510104074),
('brand_price_min', -2.2467753486894733),
('power_bin', -34.42064411731283),
('v_14', -274.7841180769423),
('kilometer', -372.897526660724),
('notRepairedDamage', -495.1903844628292),
('v_0', -2045.054957354999),
('v_5', -11022.986240536327),
('v_4', -15121.731109848046),
('v_2', -26098.299920467005),
('v_1', -45556.18929728572)]
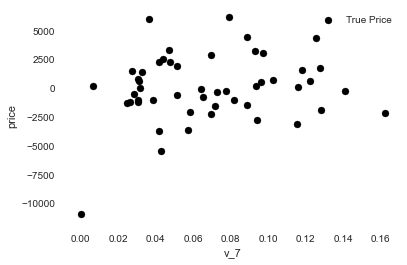
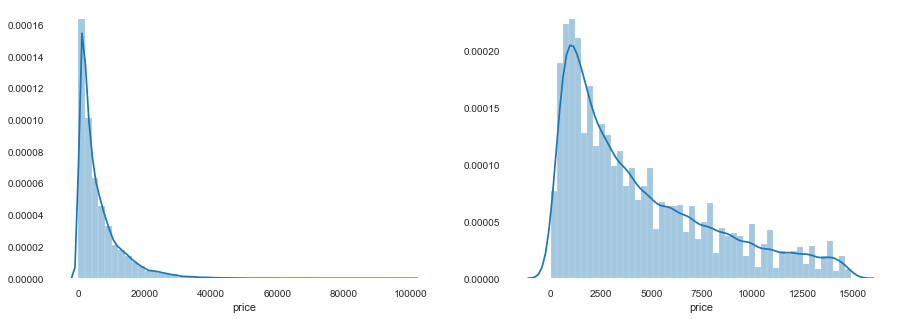
1 2 3 4 5 6 7 8 9 10 11 12 13 14 15 16 17 subsample_index = np.random.randint(low=0 , high=len (data_train_y), size=50 ) plt.scatter(data_train_X['v_9' ][subsample_index], data_train_y[subsample_index] - model.predict(data_train_X.loc[subsample_index]), color='black' ) plt.xlabel('v_7' ) plt.ylabel('price' ) plt.legend(['True Price' ,'Predicted Price' ],loc='upper right' ) print('The predicted price is obvious different from true price' ) plt.show() print('It is clear to see the price shows a typical exponential distribution' ) plt.figure(figsize=(15 ,5 )) plt.subplot(1 ,2 ,1 ) sbn.distplot(data_train_y) plt.subplot(1 ,2 ,2 ) sbn.distplot(data_train_y[data_train_y < np.quantile(data_train_y, 0.9 )])
The predicted price is obvious different from true price
It is clear to see the price shows a typical exponential distribution
<matplotlib.axes._subplots.AxesSubplot at 0x24c80b26f98>
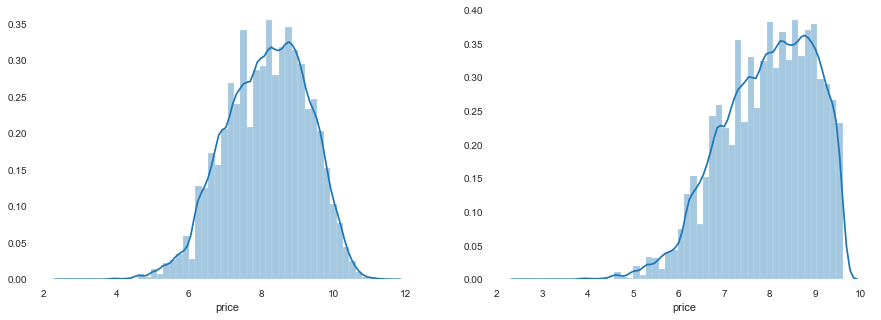
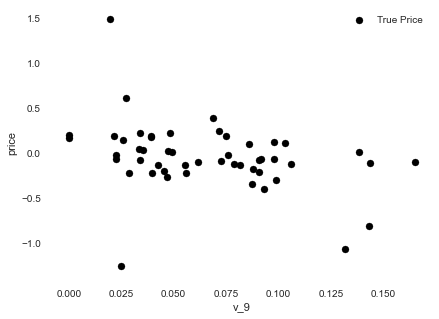
1 2 3 4 5 6 7 8 9 10 11 12 13 14 15 16 17 18 19 20 21 22 23 data_train_y_ln = np.log(data_train_y + 1 ) print('The transformed price seems like normal distribution' ) plt.figure(figsize=(15 ,5 )) plt.subplot(1 ,2 ,1 ) sbn.distplot(data_train_y_ln) plt.subplot(1 ,2 ,2 ) sbn.distplot(data_train_y_ln[data_train_y_ln < np.quantile(data_train_y_ln, 0.9 )]) model = model.fit(data_train_X, data_train_y_ln) print('intercept:' + str (model.intercept_)) sorted (dict (zip (continuous_feature_names, model.coef_)).items(), key=lambda x:x[1 ], reverse=True )subsample_index = np.random.randint(low=0 , high=len (data_train_y_ln), size=50 ) plt.figure(figsize=(15 ,5 )) plt.subplot(1 ,2 ,1 ) plt.scatter(data_train_X['v_9' ][subsample_index], data_train_y_ln[subsample_index] - model.predict(data_train_X.loc[subsample_index]), color='black' ) plt.xlabel('v_9' ) plt.ylabel('price' ) plt.legend(['True Price' ,'Predicted Price' ],loc='upper right' )
The transformed price seems like normal distribution
intercept:18.750749465662786
<matplotlib.legend.Legend at 0x24c88718e10>
1 2 3 4 5 6 7 8 9 10 11 12 13 14 import datetimesample_feature = sample_feature.reset_index(drop=True ) split_point = len (sample_feature) // 5 * 4 train = sample_feature.loc[:split_point].dropna() val = sample_feature.loc[split_point:].dropna() train_X = train[continuous_feature_names] train_y_ln = np.log(train['price' ] + 1 ) val_X = val[continuous_feature_names] val_y_ln = np.log(val['price' ] + 1 ) model = model.fit(train_X, train_y_ln) mean_absolute_error(val_y_ln, model.predict(val_X))
0.19577667270300972
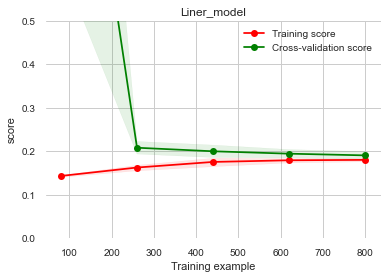
1 2 3 4 5 6 7 8 9 10 11 12 13 14 15 16 17 18 19 20 21 22 23 24 25 26 27 28 29 30 31 32 33 34 35 36 from sklearn.model_selection import learning_curve, validation_curvefrom sklearn.model_selection import cross_val_scorefrom sklearn.metrics import mean_absolute_error, make_scorer? learning_curve def plot_learning_curve (estimator, title, X, y, ylim=None , cv=None , n_jobs=1 , train_size=np.linspace(.1 , 1.0 , 5 ): plt.figure() plt.title(title) if ylim is not None : plt.ylim(*ylim) plt.xlabel('Training example' ) plt.ylabel('score' ) train_sizes, train_scores, test_scores = learning_curve( estimator, X, y, cv=cv, n_jobs=n_jobs, train_sizes=train_size, scoring=make_scorer(mean_absolute_error)) train_scores_mean = np.mean(train_scores, axis=1 ) train_scores_std = np.std(train_scores, axis=1 ) test_scores_mean = np.mean(test_scores, axis=1 ) test_scores_std = np.std(test_scores, axis=1 ) plt.grid() plt.fill_between(train_sizes, train_scores_mean - train_scores_std, train_scores_mean + train_scores_std, alpha=0.1 , color="r" ) plt.fill_between(train_sizes, test_scores_mean - test_scores_std, test_scores_mean + test_scores_std, alpha=0.1 , color="g" ) plt.plot(train_sizes, train_scores_mean, 'o-' , color='r' , label="Training score" ) plt.plot(train_sizes, test_scores_mean, 'o-' , color="g" , label="Cross-validation score" ) plt.legend(loc="best" ) return plt plot_learning_curve(LinearRegression(), 'Liner_model' , data_train_X[:1000 ], data_train_y_ln[:1000 ], ylim=(0.0 , 0.5 ), cv=5 , n_jobs=1 )
<module 'matplotlib.pyplot' from 'C:\\Users\\Carlos\\AppData\\Roaming\\Python\\Python36\\site-packages\\matplotlib\\pyplot.py'>
1 2 3 4 5 6 7 8 9 10 11 from sklearn.linear_model import LinearRegression, Ridge, Lassomodels = [LinearRegression(), Ridge(), Lasso()] result = dict () for model in models: model_name = str (model).split('(' )[0 ] scores = cross_val_score(model, X=data_train_X, y=data_train_y_ln, verbose=0 , cv = 5 , scoring=make_scorer(mean_absolute_error)) result[model_name] = scores print(model_name + ' is finished' ) result = pd.DataFrame(result) result.index = ['cv' + str (x) for x in range (1 , 6 )] result
LinearRegression is finished
Ridge is finished
Lasso is finished
LinearRegression
Ridge
Lasso
cv1
0.190792
0.194832
0.383899
cv2
0.193758
0.197632
0.381893
cv3
0.194132
0.198123
0.384090
cv4
0.191825
0.195670
0.380526
cv5
0.195758
0.199676
0.383611
1 2 3 4 5 6 7 8 9 10 11 12 13 14 15 16 17 18 19 20 21 22 23 from sklearn.linear_model import LinearRegressionfrom sklearn.svm import SVCfrom sklearn.tree import DecisionTreeRegressorfrom sklearn.ensemble import RandomForestRegressor, GradientBoostingRegressorfrom sklearn.neural_network import MLPRegressorfrom xgboost.sklearn import XGBRegressorfrom lightgbm.sklearn import LGBMRegressormodels = [LinearRegression(), DecisionTreeRegressor(), RandomForestRegressor(), GradientBoostingRegressor(), MLPRegressor(solver='lbfgs' , max_iter=100 ), XGBRegressor(n_estimators = 100 , objective='reg:squarederror' ), LGBMRegressor(n_estimators = 100 )] result = dict () for model in models: model_name = str (model).split('(' )[0 ] scores = cross_val_score(model, X=train_X, y=train_y_ln, verbose=0 , cv = 5 , scoring=make_scorer(mean_absolute_error)) result[model_name] = scores print(model_name + ' is finished' ) result = pd.DataFrame(result) result.index = ['cv' + str (x) for x in range (1 , 6 )] result.T
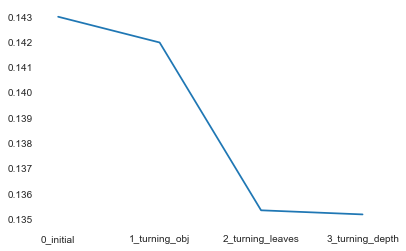
1 2 3 4 5 6 7 8 9 10 11 12 13 14 15 16 17 18 19 20 21 22 23 24 25 26 27 28 29 objective = ['regression' , 'regression_l1' , 'mape' , 'huber' , 'fair' ] num_leaves = [3 ,5 ,10 ,15 ,20 ,40 , 55 ] max_depth = [3 ,5 ,10 ,15 ,20 ,40 , 55 ] bagging_fraction = [] feature_fraction = [] drop_rate = [] best_obj = dict () for obj in objective: model = LGBMRegressor(objective=obj) score = np.mean(cross_val_score(model, X=train_X, y=train_y_ln, verbose=0 , cv = 5 , scoring=make_scorer(mean_absolute_error))) best_obj[obj] = score best_leaves = dict () for leaves in num_leaves: model = LGBMRegressor(objective=min (best_obj.items(), key=lambda x:x[1 ])[0 ], num_leaves=leaves) score = np.mean(cross_val_score(model, X=train_X, y=train_y_ln, verbose=0 , cv = 5 , scoring=make_scorer(mean_absolute_error))) best_leaves[leaves] = score best_depth = dict () for depth in max_depth: model = LGBMRegressor(objective=min (best_obj.items(), key=lambda x:x[1 ])[0 ], num_leaves=min (best_leaves.items(), key=lambda x:x[1 ])[0 ], max_depth=depth) score = np.mean(cross_val_score(model, X=train_X, y=train_y_ln, verbose=0 , cv = 5 , scoring=make_scorer(mean_absolute_error))) best_depth[depth] = score sbn.lineplot(x=['0_initial' ,'1_turning_obj' ,'2_turning_leaves' ,'3_turning_depth' ], y=[0.143 ,min (best_obj.values()), min (best_leaves.values()), min (best_depth.values())])
<matplotlib.axes._subplots.AxesSubplot at 0x24c92d99438>
1 2 3 4 5 6 7 8 9 10 from sklearn.model_selection import GridSearchCVparameters = {'objective' : objective , 'num_leaves' : num_leaves, 'max_depth' : max_depth} model = LGBMRegressor() clf = GridSearchCV(model, parameters, cv=5 ) clf = clf.fit(data_train_X, data_train_y) print(clf.best_params_) model = LGBMRegressor(objective='regression' , num_leaves=55 , max_depth=15 ) np.mean(cross_val_score(model, X=data_train_X, y=data_train_y_ln, verbose=0 , cv = 5 , scoring=make_scorer(mean_absolute_error)))
{'max_depth': 15, 'num_leaves': 55, 'objective': 'regression'}
0.13754820909576437
Merging Theory 1
简单加权融合:
回归(分类概率):算术平均融合(Arithmetic mean), 几何平均融合(Geometric mean);
分类:投票(Voting)
综合:排序融合(Rank averaging), log融合
stacking/blending:
boosting/bagging(在xgboost, Adaboost, GBDT中已经用到):
2
结果层面的融合,这种是最常见的融合方法,其可行的融合方法也有很多,比如根据结果的得分进行加权融合,还可以做Log,exp处理等。在做结果融合的时候,有一个很重要的条件是模型结果的得分要比较近似,然后结果的差异要比较大,这样的结果融合往往有比较好的效果提升。
特征层面的融合,这个层面其实感觉不叫融合,准确说可以叫分割,很多时候如果我们用同种模型训练,可以把特征进行切分给不同的模型,然后在后面进行模型或者结果融合有时也能产生比较好的效果。
模型层面的融合,模型层面的融合可能就涉及模型的堆叠和设计,比如加Staking层,部分模型的结果作为特征输入等,这些就需要多实验和思考了,基于模型层面的融合最好不同模型类型要有一定的差异,用同种模型不同的参数的收益一般是比较小的。
Practice 1 2 3 4 5 6 7 8 9 10 11 12 13 14 15 16 17 18 19 20 21 22 23 24 25 26 27 import osimport shutilimport numpy as npimport pandas as pdimport pandas_profiling as pdpfimport timeimport warningswarnings.filterwarnings('ignore' ) import matplotlibimport matplotlib.pyplot as pltimport seaborn as sbn%matplotlib inline import missingno as msnoimport pivottablejsimport lightgbm as lgbimport xgboost as xgbfrom sklearn.decomposition import PCA, FastICA, FactorAnalysis, SparsePCAfrom sklearn.model_selection import GridSearchCV, cross_val_score, StratifiedKFold, train_test_splitfrom sklearn.metrics import mean_squared_error, mean_absolute_erroros.chdir(r"D:\Tianchi" )
1 2 3 4 5 6 7 8 9 10 11 12 13 14 15 16 17 18 19 ''' 数据含义 SaleID 交易ID,唯一编码 name 汽车交易名称,已脱敏 regDate 汽车注册日期,例如20160101,2016年01月01日 model 车型编码,已脱敏 brand 汽车品牌,已脱敏 bodyType 车身类型:豪华轿车:0,微型车:1,厢型车:2,大巴车:3,敞篷车:4,双门汽车:5,商务车:6,搅拌车:7 fuelType 燃油类型:汽油:0,柴油:1,液化石油气:2,天然气:3,混合动力:4,其他:5,电动:6 gearbox 变速箱:手动:0,自动:1 power 发动机功率:范围 [ 0, 600 ] kilometer 汽车已行驶公里,单位万km notRepairedDamage 汽车有尚未修复的损坏:是:0,否:1 regionCode 地区编码,已脱敏 seller 销售方:个体:0,非个体:1 offerType 报价类型:提供:0,请求:1 creatDate 汽车上线时间,即开始售卖时间 price 二手车交易价格(预测目标) v系列特征 匿名特征,包含v0-14在内15个匿名特征 '''
